When it comes to growing a business, not all customers are created equal. Your total purchasers can be divided into two important groups: first-time buyers and repeat buyers. Understanding this breakdown can help you prioritize your strategies—whether that means acquiring new users or improving satisfaction to drive repeat purchases. Let’s dive into the data and learn how to make informed decisions.
What Does the Data Say?
Here’s a breakdown of Google Merchandise Store’s buyers from June to August 2024:
| Total Buyer | First-Time | Repeat | |
| June 2024 | 1,235 | 1,223 | 12 |
| July 2024 | 1,322 | 1,319 | 3 |
| August 2024 | 1,834 | 1,832 | 2 |
As you can see, the vast majority of customers are first-time buyers. Repeat purchases are minimal, with only a handful of customers returning in subsequent months.
What could this mean? For a store selling branded merchandise like Google’s, this trend is expected—customers likely buy a t-shirt or mug as a one-time novelty. However, if this data belonged to a consumer goods e-commerce site, the lack of repeat buyers would signal a need to focus on improving customer satisfaction and loyalty.
Key Insights for Business Strategy
Analyzing first-time and repeat buyers can help you decide where to focus your efforts:
- If first-time buyers are low:
- Focus on new user acquisition.
- Run marketing campaigns aimed at attracting new customers.
- If repeat buyers are low:
- Focus on improving customer satisfaction.
- Adjust your marketing to target existing users with retargeting campaigns and special offers.
Real-World Example: Tracking Revenue
Revenue is one of the most critical indicators of business health. While there are countless terms related to revenue—ARPU (Average Revenue Per User), ARPPU (Average Revenue Per Paying User), up-selling, cross-selling—these terms all exist because revenue is the lifeblood of any business. Even startups focused on growth rather than immediate profits eventually need to translate that growth into revenue to survive.
How to Track First-Time and Repeat Purchases in Google Analytics
With Google Analytics, tracking these metrics is simple and highly effective. Here’s how:
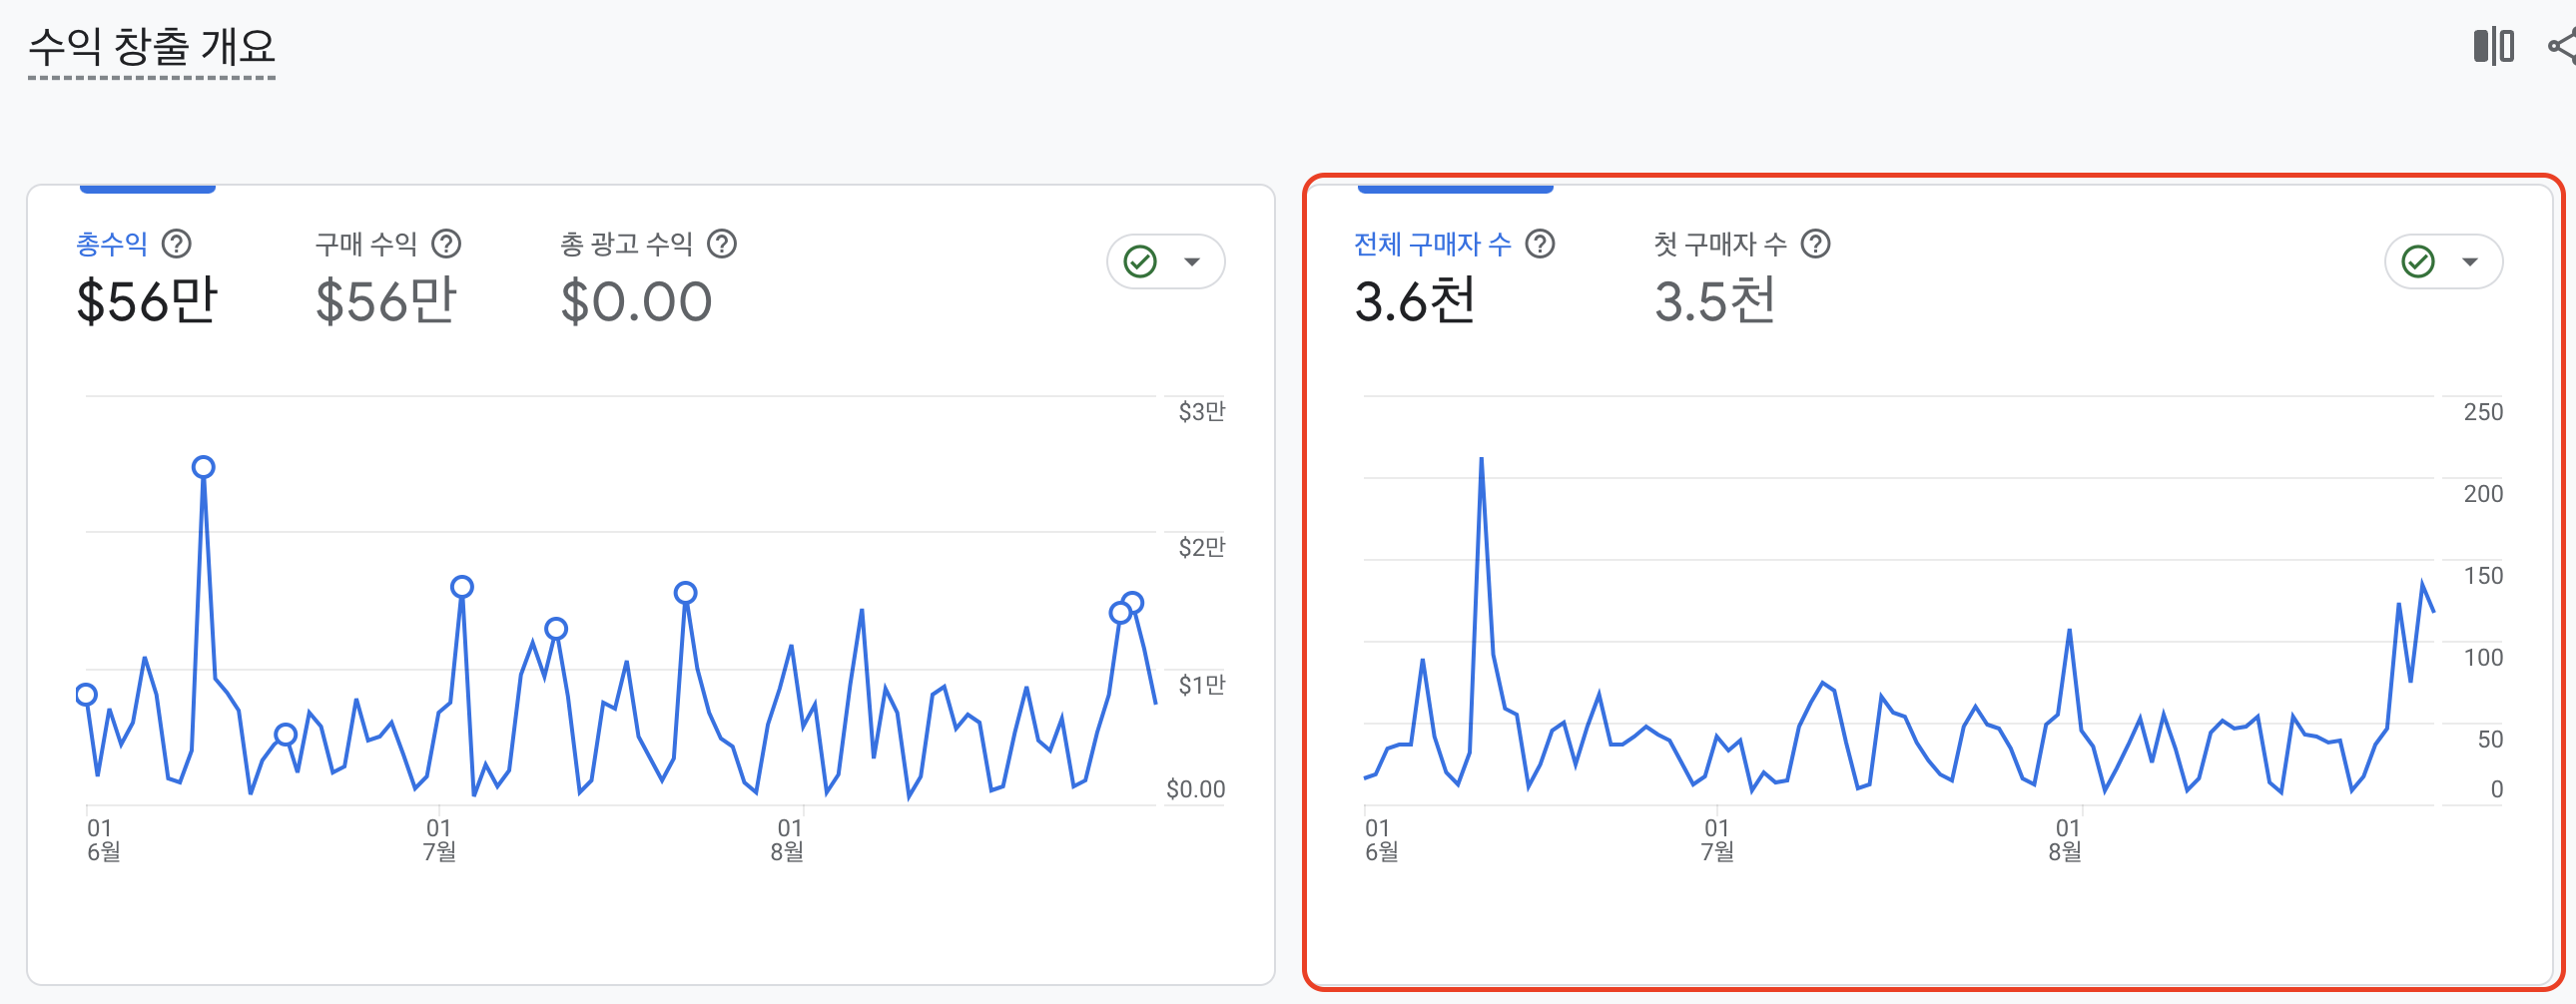
Use the Revenue Overview Report
The Revenue Overview Report gives you a quick glance at total buyers and first-time buyers.
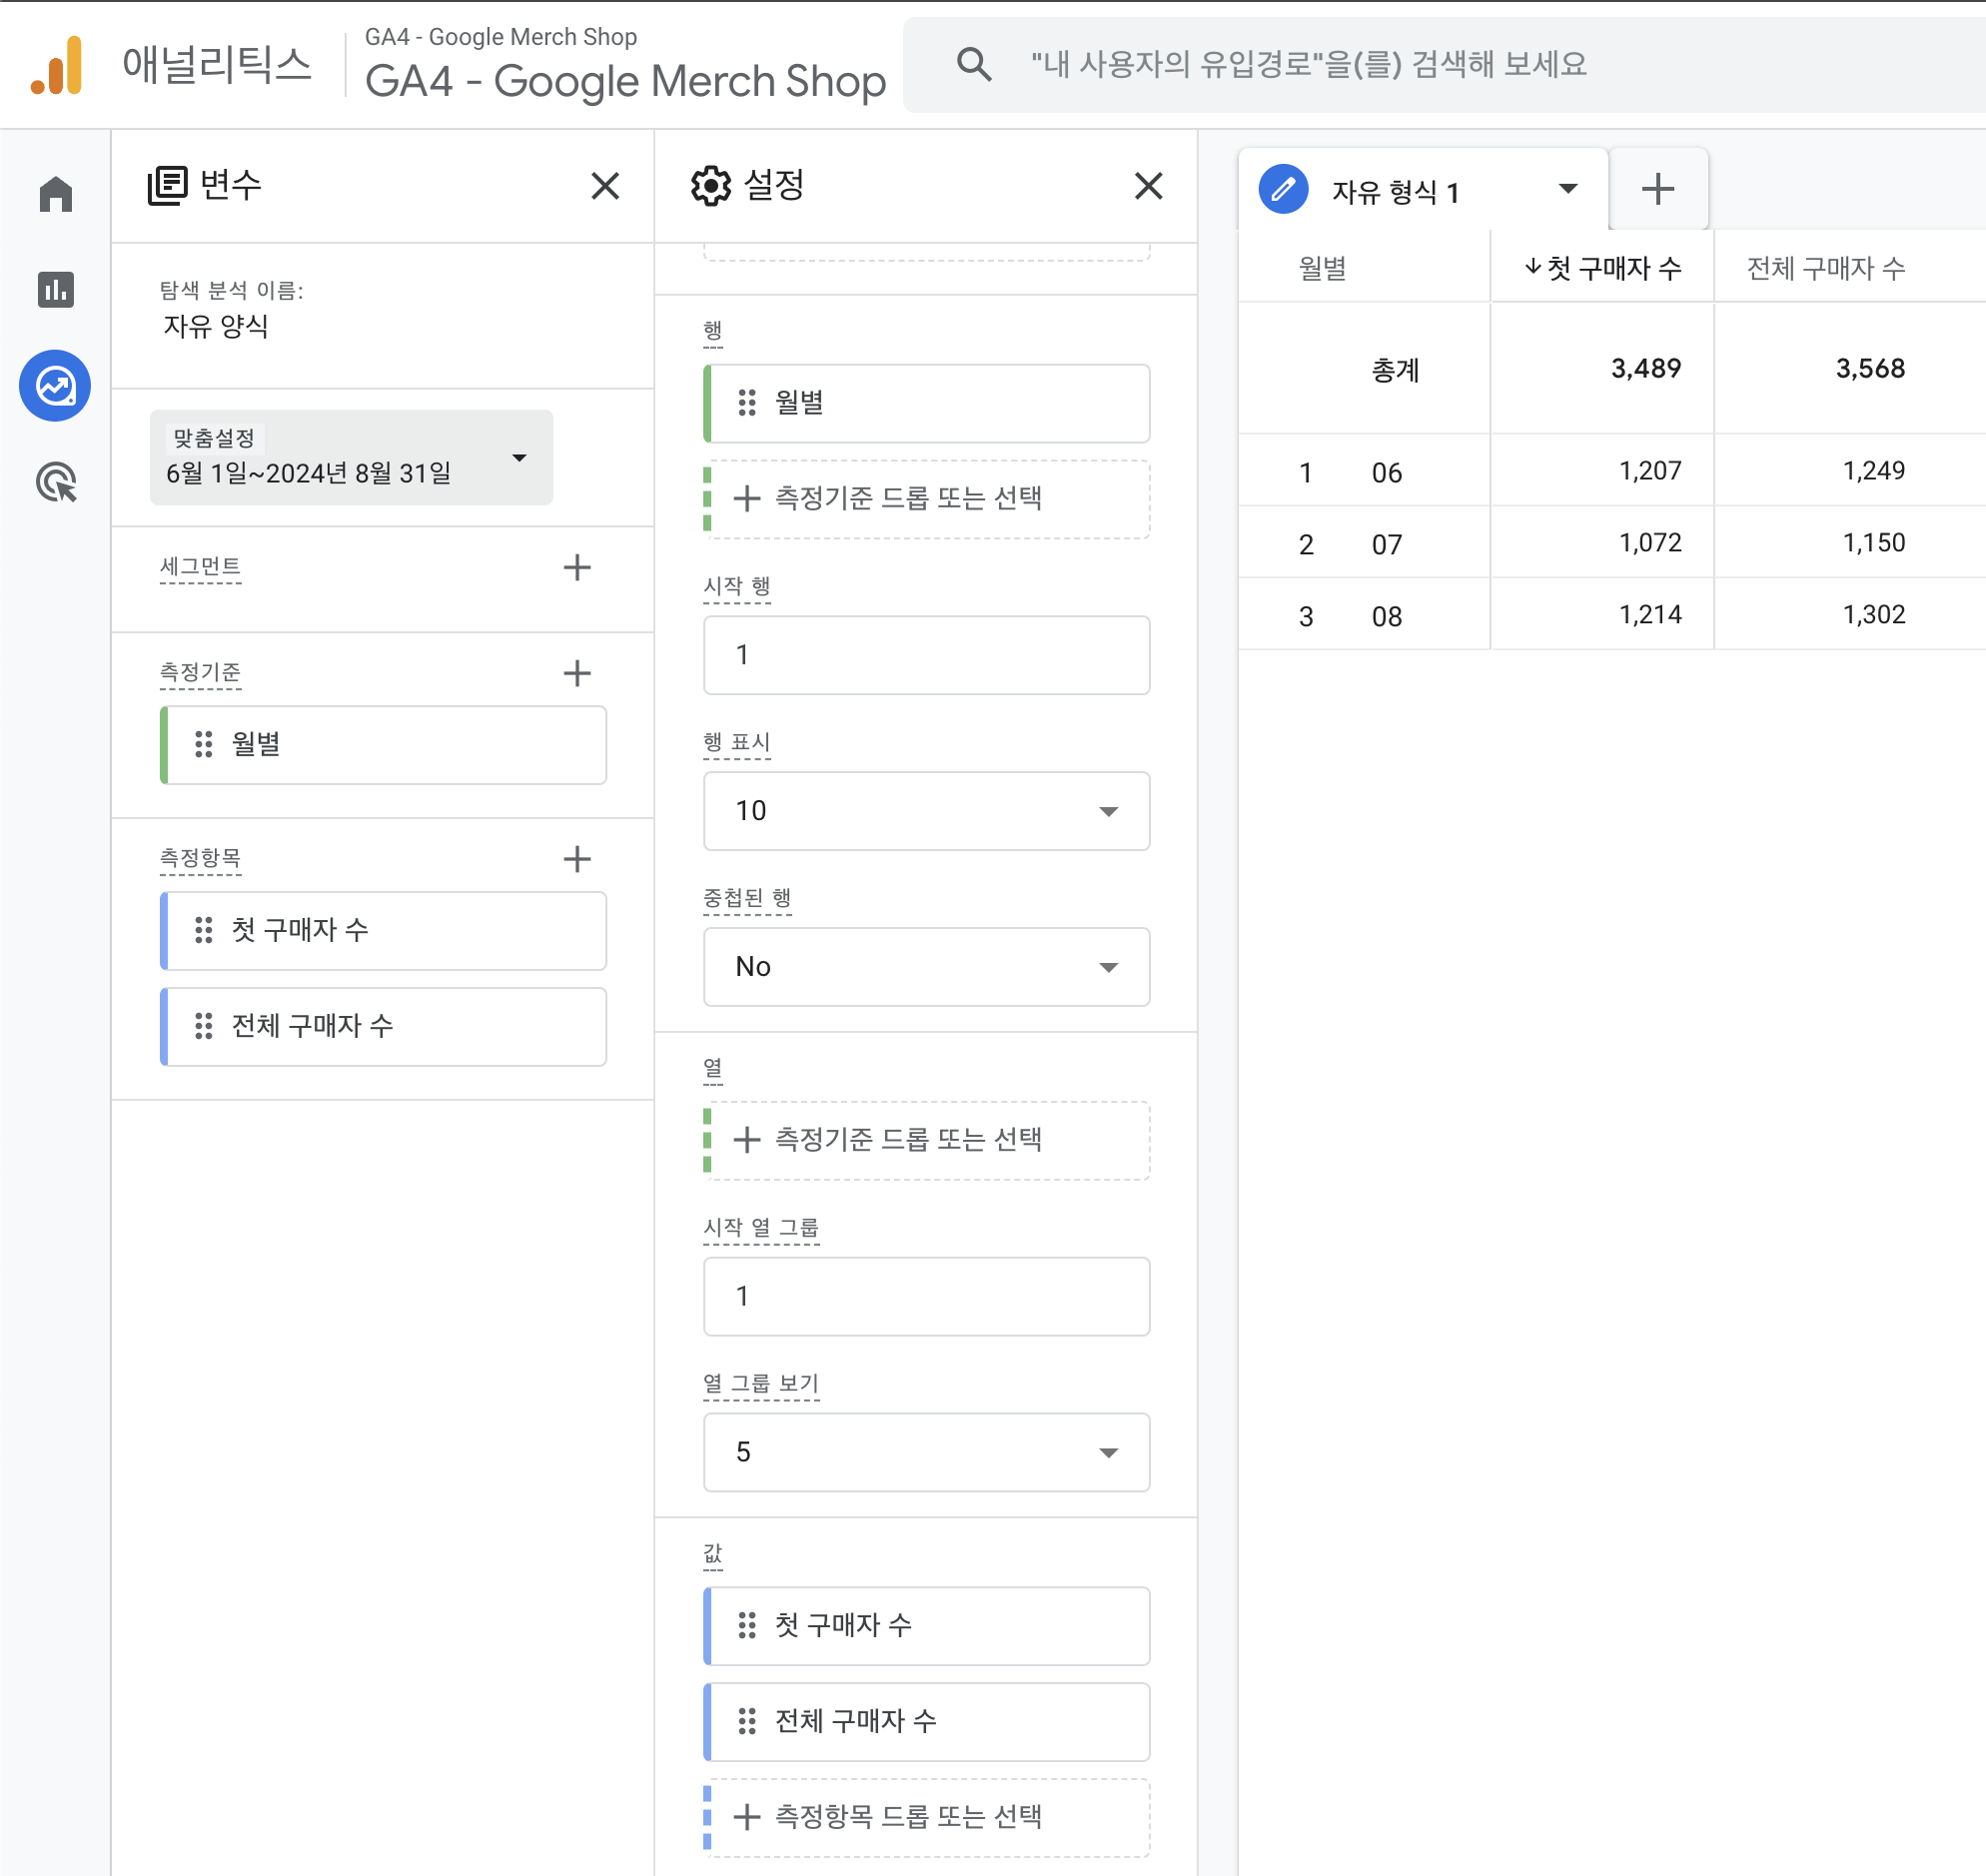
Set Up a Custom Exploration
Want a more detailed view? Follow these steps to build a custom exploration:
- Go to Explore and select Free Form analysis.
- Add Monthly as a dimension under Time.
- Add Total Purchasers and First-Time Purchasers as metrics.
- Choose Table as your visualization type.
- Drag Month to the rows and Purchasers metrics to the values.
- Download the data and calculate repeat buyers by subtracting first-time purchasers from the total.
Making the Most of Your Data
By breaking down your revenue into first-time and repeat purchases, you gain a clear understanding of your customer base and can fine-tune your strategies. Whether your goal is to bring in more new users or to keep existing ones coming back, these insights will guide you in the right direction.
Remember: Revenue isn’t just a number—it’s a signal from your users. Use it to navigate your next steps and drive sustainable growth.
So, What’s the Takeaway?
By understanding your first-time and repeat buyers, you’ll gain the insights needed to fine-tune your business strategy. Want more customers? Double down on user acquisition. Want higher loyalty? Focus on delighting your existing users.
Revenue isn’t just a number—it’s your users telling you how they feel about your product. Use that signal to guide your next move and keep your business growing. 😊
'Self_Study' 카테고리의 다른 글
| Starting Revenue Analysis with GA4 Free-Form Exploration (0) | 2025.01.08 |
|---|---|
| Revenue Analysis: Breaking Down Key Metrics (0) | 2025.01.08 |
| Stickiness: Why It’s Important for User Engagement (0) | 2025.01.07 |
| Why Retention is the Key to Growth (0) | 2025.01.07 |
| Funnels Are Not One-Size-Fits-All (2) | 2025.01.07 |